An Analysis of Bacteria Risk at New Jersey Beaches
A special thanks to Dr. Jason Adolf at Monmouth University for his insight and sharing this data with me.
Do I Need to Worry on the East Coast?
For a bit of background, it’s well known that surfing after the rain in California, particularly Southern California/LA, carries a fair amount of risk of sinus infections and GI upset. People have become very sick from surfing places like Imperial Beach, which is just north of Tijuana and the Tijuana slough. That region is known for having issues with raw sewage entering the water.
Currently, California recommends that surfers and beachgoers avoid contact with ocean water for 72 hours following a rainfall event of at least 0.2” (IIRC) to prevent infections.
Now, it’s important to discuss some important ways that the east coast differs from the west coast. One, California is hilly/mountainous near the coast. This means that when it rains, everything runs down hill. That could be storm drain runoff but farm runoff as well. The ocean is really a low point, unlike the east coast, where everything is pretty flat (with the exception of the northeast).
The next major difference is in the amount of impermeable land (as in roads, infrastructure, etc.). While there are areas that have significant impermeable coverage on the east coast (see Myrtle Beach, Va Beach, etc.), we tend to have more grassy areas and homes near the coast. We also have considerably more sand and far less rocky coastline (except the northeast). If you’ve spent time in CA, you know that they have a beautiful, but often rocky, coastline. The beaches tend to be way narrower and beach replenishment isn’t done like it is on the east coast. Take Va Beach for instance. There’s a number of areas where it takes minutes to even be able to run from a concrete area to the waterline. Natural runoff has a long way to go to make it to the ocean.
Third, we have less farmland near the coast in most states (Florida being the exception). Animal waste runoff can really add to bacteria levels and is considered part of the issue in California.
And lastly, we get more rain overall than CA. CA has long periods of little to no rain. The east coast gets considerably more rain and rain events.
But, should you be concerned about bacteria levels after the rain anyway?
Well, Sort Of…
Depending on where you choose to paddle out or swim around, the bacteria levels can certainly reach levels that are well over the recommended limit. Most of us that have lived at the beach for awhile will remember stories in the news about beaches needing to be closed for a short time. Bays and inland waterways always tend to be worse, and can have other varieties of bacteria that can be quite nasty (see Vibrio).
Luckily, we have some monitoring here (as do many states) that can show us a bit of the risk and allow us to make more informed decisions.
First, Let’s Dispel this Myth
- Bacteria is only an issue in the summer.
Enterococcus values over state guidelines have been found in 6.5C (~43F) degree water, which is pretty close to our average low water temp in the winter. Maybe not last year, but the long run average. Given that this study only sampled a small total number of days tells us that cold water isn’t enough to prevent risk.
Yes, warmer temps should support bacteria growth moreso than cold temps, but it’s not as important of a feature as many of us would hope.
So, Which Factors Matter?
Overwhelmingly, the main environmental factor that predicts over-limit enterococcus level is recent rainfall. With the exception of the Wesley Lake Outfall, only one sample (at one location) returned an above limit value with no rainfall in the past 24 hours.
Of the factors examined, rainfall within the last six hours mattered the most and within 24 hours the least. This implies that recent rainfall is the single most important independent factor to consider.
A Look at the Data
All Data from Adolf, J.E., et. al. 2023 (see references below)
I’ll walk y’all through the data that the paper was based on with some figures that I made. We’ll start with a overview of the sampled sites and then go into the data collected.
The methodology of the study was to sample 5 (eventually 4) sites on the same day/same environmental conditions throughout the year and examine which features were predictive of whether a sample would be above the recommended limit of entero or under.
First, let’s look at the site-site correlation:
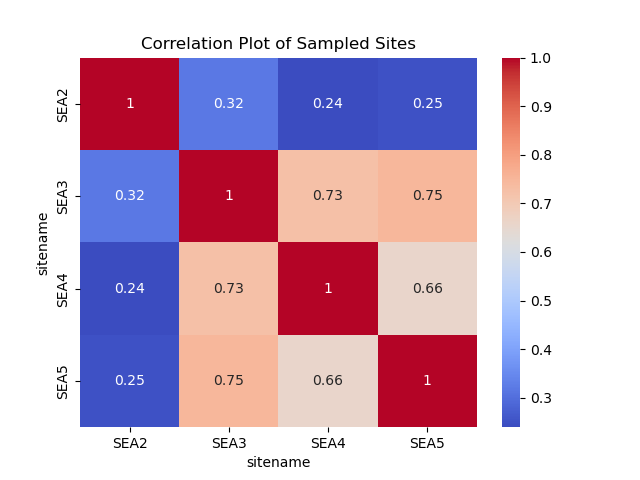
As we can see, site SEA2 is far less correlated than sites 3,4, and 5. This is seen further on as models trained on those samples are poor predictors of site SEA2 bacteria values.
For the purposes of the next plot, I separated site SEA2 from the others. This next plot is the correlation matrix (pearson correlation) for the environmental variables relative to above/below limit results.
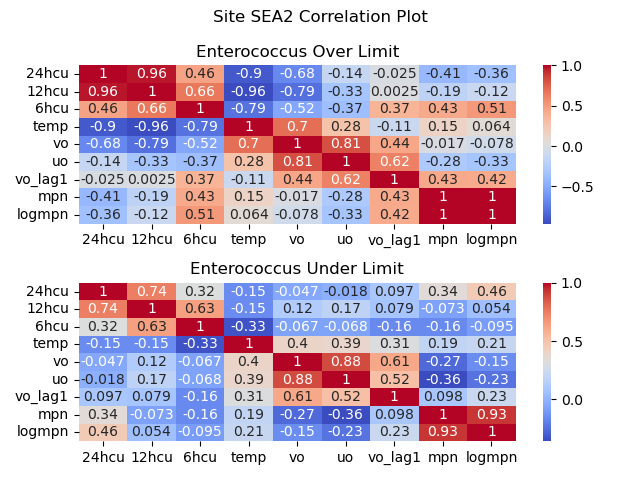
To read this plot, look at the rightmost column and look at either highest or most negative values. MPN and Logmpn should be highly correlated, they are the same thing. As you can see, 6hcu (6 hour rainfall) is the most important factor for predicting over limit samples. The variables “vo” and “uo” are northward and eastward current velocity components and “vo_lag1” is the prior day current value for northward current.
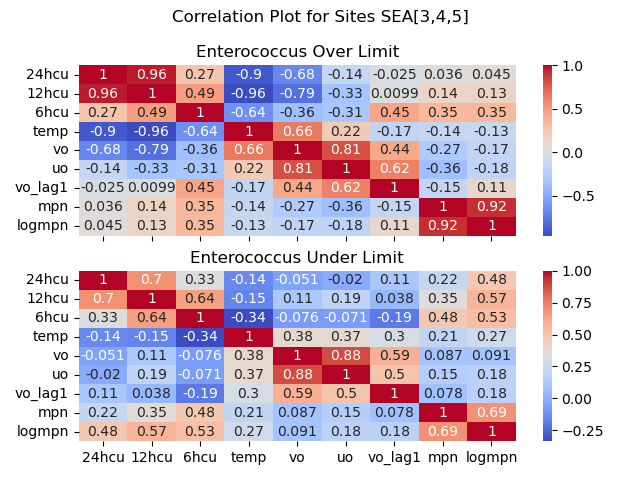
With sites 3,4, and 5, the only important values are rainfall. Note that both under and over limit samples have a positive correlation with rainfall within 24 hours but also note how that correlation reduces with time for the over limit values. We’ll touch on that in a minute.
Let’s look at the stats broken down by each site:
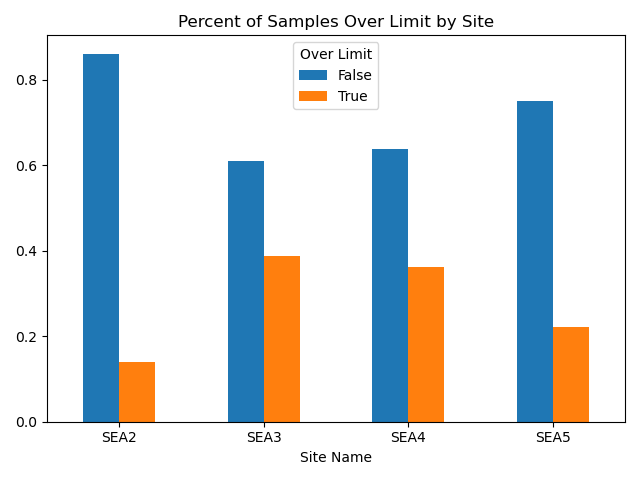
This chart shows the percent of samples over the limit in orange and under the limit in blue for each site. SEA2 shows the cleanest water and sites 3 and 4 show the worst water quality.
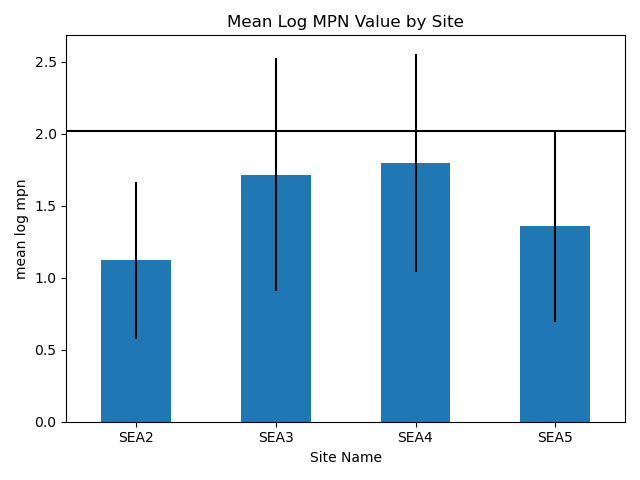
This chart shows the mean log10 MPN values with error bars being the standard deviation in the values. The horizontal black line is equal to 2.017 or log10(104) which is the recommended limit of entero values. Sites 2 and 5 are mostly under the limit, statistically.
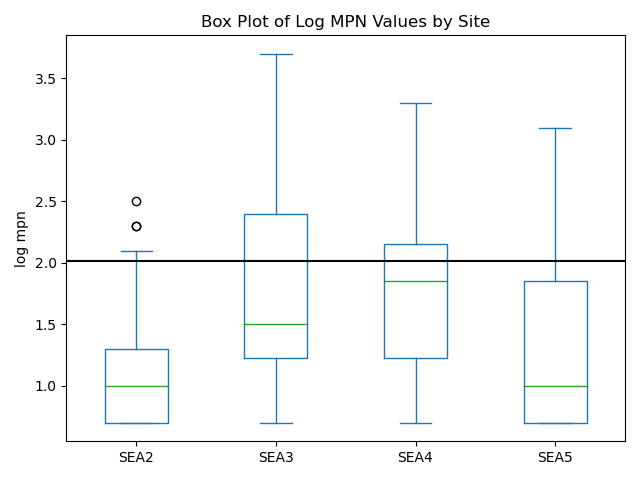
This chart shows the box and whisker plot for each site’s logmpn values. The box shows the first (bottom) and third (top) quartiles with the horizontal line inside the box being the median value. The whiskers show points within 1.5 times the inter quartile range. Lastly, the dots (fliers) are considered outlier values from the rest of the data. The horizontal black line is, again, the over/under limit of acceptable entero values.
Conclusions from the Data
First, we can see that not all sites are equivalent, and environmental conditions that predict one site may not predict another site that isn’t correlated to it. Further analysis of this data shows that sites 3,4, and 5 can be used to predict other site 3,4, and 5 values quite accurately. However, site SEA2 values aren’t as convenient.
Unsurprisingly, this site does vary from the others in that outfall doesn’t drain directly into the surf zone as is the case for sites SEA3,4,5. At site SEA2, outflow drains into the back beach area and researchers point out that it is likely attenuated by the sand before reaching the ocean (Adolf, et al. 2023). Essentially, if you use a prediction model trained on those other three sites, you’ll see false positives at site SEA2.
We can take from all of this that some beaches will be safer to surf post rain than others, particularly those that have outfall pipes draining into the surf zone. While this seems like common sense, it’s an important point. Plus, many of the best surf beaches have outfall pipes.
Skipping to the box plot, we can see that over time certain beaches are going to show as safer than others. Statistically, site SEA2 is almost always safe based on the limited testing done. Your odds of getting sick at that site are considerably lower than at the other sites tested both in terms of percent of the time over the limit as well as having lower overall values when it was over the limit.
Remaining Questions
My first question would have to be, is all of this hyperlocal? In other words, does current matter? Or length of time between rains?
From my limited examination and means, I don’t see much of an effect from those factors. This really surprised me. As surfers, we know that northeast winds and currents bring more trash to our beaches than south currents/wind. I would also think that the longer time between rains would mean more stuff and more runoff. I originally had a count of days without rain as a feature and it showed no correlation with over-limit samples (or under-limit). It had no predictive power from my examination.
There were some limitations. The data from this paper was gathered in 2019-2020 and I can only get daily northward/eastward current data from that time period. Hour to hour data isn’t available going back that far, at least from the limited sources available to me.
Lastly, Will I Get Sick Surfing a Spot Over the Limit?
This is quite a bit harder to answer. Values of over 20,000 mpn have been recorded in previous examinations. I wouldn’t want to be in the water if that was the case. The highest value this study returned was 4,884 (second highest was 2224 and highest at site SEA2 was 282). Realistically, it depends on the magnitude above the limit as well as your immune system and luck.
Personally, when surfing after (particularly) recent rain, I’d pick a spot with known past lower values and avoid spots that drain from lakes/ponds or inlets. Luckily, with the Surfrider Blue Water Task Force testing, which will be year round, we should get a better idea of where the safest spots will be.
Generally, your biggest risk is going to be ear infections/sinus infections and infected cuts. If you have an open wound, maybe let it heal before surfing right by an outfall location or inlet. A study looking at both dry (surfers generally) and wet weather exposure (post rain) saw incidence ratios jump from 1.86 to 3.28 for ear aches/infections and 3.04 to 4.96 for infected wounds (Arnold et. al., 2017). Essentially, if you surf after rain (in San Diego), you have five times the chance of getting an infected cut surfing post rainfall relative to someone not surfing and 3.3 times the chance of an ear infection.
Realistically, it’s the east coast. We mainly get waves after the rain. I’m still going. There’s people that surf Imperial Beach in San Diego when it’s on. I wouldn’t do that myself. It’s all about risk tolerance and mitigating the known risks as well as you can.
I hope you learned a little bit from this one; see y’all out there!
References
Adolf, J.E., Weisburg,J.,Hanna,K. et al. Enterococcus exceedances related to environmental variability at New Jersey ocean beaches. Environ Monit Assess 195, 250 (2023). https://doi.org/10.1007/s10661-022-10788-0
Arnold, B.F., Schiff, K. C., Ercumen, A., Benjamin-Chung, J., Steele, J. A., Griffith, J.F., Steinberg, S. J., Smith, P., McGee, C.D., Wilson, R., Nelsen, C., Weisberg, S.B., & Colford, J. M. (2017). Acute illness among surfers after exposure to seawater in dry-and wet-weather conditions. American Journal of Epidemiology, 186(7), 866-875. https://doi.org/10.1093/aje/kwx019
Current data from Copernicus Marine Service
Rain data from NJ DEP DWM&S Rainfall Data Acquisition njdep rain map