House Math
Not my usual subject, but interesting none the less
Still working on this one but it’s getting there.
I’m going to take a break from my normal, math heavy forecasts to go into another, math heavy subject, purchasing a home. I’m mainly writing this as I did this analysis myself while looking for a property in this great and impossible to live in county and, while it didn’t help me obtain a home, i learned a lot from completing it. The main subject is going to be the math on renting vs. buying and when it makes sense to do one or the other.
The normal disclaimer of your mileage may vary applies, but by the end of this blog post, you should have a better understanding of what the costs are associated with buying (and selling) a home, and whether it makes sense to look down the nightmare inducing maw of the current housing market in this lovely state.
A quick note before I start throwing formulas (it’s literally just algebra, chill) at you. You don’t need to do any of this math to buy a home. The main thing is to understand what the mathematical relations are saying and what happens when you change the numbers around. While it can be helpful to calculate an actual breakeven at some point, there are likely calculators out there to help you with that. With that out of the way, let’s get started with the amortization schedule and what a mortgage calculator does behind the scenes:
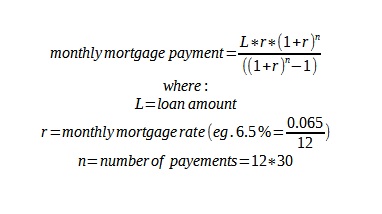
This is the math for calculating the amortized loan payment for a 30 year fixed rate mortgage. It’s the same for a 15 year if you switch that 30 in number of payments to 15. The total amount you owe on a mortgage is the monthly mortgage amount times the number of payments, which will likely be a larger number than you’re expecting. But, there’s more to add to that to get your actual total monthly payment because there’s also taxes and insurance to think about:
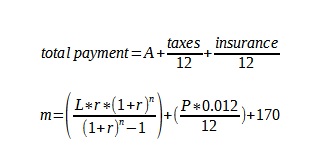
P being the price of the home and r being the monthly interest rate. I used 2k annualy for insurance which gives that ~170/month, which may or may not be enough for what you’re looking at. Typically, I would add another 1%/year for maintenance costs, but that isn’t typically done by a mortgage calculator. For the analysis further in the post, I added that in to the monthly payment.
To round out the money going out of your pocket part of buying a house, we need to look at closing costs on both the buy and sell side. That’s simple enough to just type out. Assume around 3% of the purchase price in buyer side costs and 8% in seller side costs at the time of sale:
C = (0.03xP) + (0.08xP) + (0.08xA) = (0.03xP) + 0.08(P+A)
where P is the sale price and I is the appreciation you accrued over the time the house was owned (eg. 8% of the sale price). Basically, the more your house appreciates, the larger the amount of closing costs you will have to pay. Still better than not having the house increase in value, but it plays a role in our breakeven analysis.
Now, let’s try to get a full equation together to describe the “buy” side of the rent vs buy question:
Buying = A-mt-C
where:
A = home price appreciation m = total monthly payment + maintenance fees (1% of home price/year give or take) C = buy/sell costs as well as any one time costs (like redoing a kitchen, etc.)
Switching over to rent, the math is quite a bit easier if you don’t go too far into modeling an investment portfolio and instead use the 10 year treasury as a risk free rate of return. I’m assuming this is a fixed income being applied to rent for the purposes of this post. It’s considerably easier than modeling stock returns over time, especially given the state of the market.
Let’s calculate the effective rent as a function of the down payment (D) we’d be putting on the home and assuming that is the extent of our liquid assets. Given this is Monmouth County, it pretty much has to be to get a house around here.
rent cost = (D(1+R)-D) - r
where: D is the down payment amount, R is the risk free rate of return (~0.045) and r is the monthly rent amount.
Putting it Together
We want to know where rent = buy to calculate a breakeven:
Rent = Buy (D(1+0.045)-D) - r = I-mt-C
The next step is to run out the amortization schedule and get the remaining balance, principle and interest payed, and the interest earned at each time step for the 30 year period on the home. Let’s look at a typical chart for something like this given a 1M dollar home (did I mention it’s Monmouth County yet?) with a down payment of 20%. In this case, the buyer got lucky and only had 20k of necessary costs and not the 150k+ most homes on the market need these days.
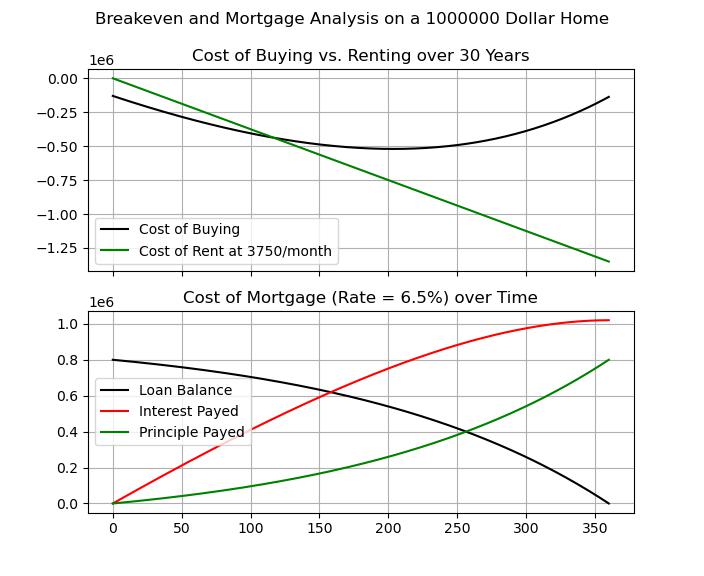
The main takeaway here is that most people forget about the closing costs and initial money spent when you own a home. There’s a lot of fees, taxes, etc. associated with that purchase and that’s before you get into needing new appliances, yard equipment, etc. Throw in a remodel because the better half wants the bathroom to look like something off Instagram and you’re quickly in for another 50k on top of those necessary fees. But, there’s more. You also get hit with a lot of those same fees (but more) when you go to sell your house. Around 8% is to be expected in closing costs on the sell side.
So, while rent is pure negative cash flow, you start off with another 100k+ in costs you didn’t have to pay. The main difference is the leverage you get with a mortgage to earn interest on the full value of the home, as well as the slow increase in monthly payments going to principle (eg. you and not the bank). But it’s critical to realize how important the appreciation rate is on the home you’re buying (wouldn’t it be great if that was in the ad?). The following chart is probably the most important thing you’ll look at if planning on purchasing a home:
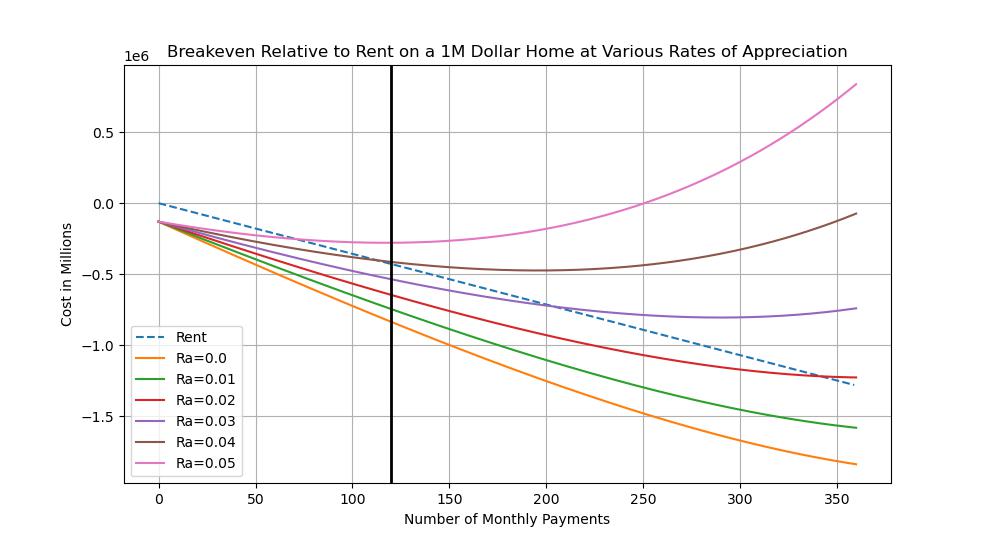
Rent assumes 4500/month less the risk free rate on the deposit money. The dark vertical line represents 10 years. Notice that you only break even on this property within a decade if you get ~4% appreciation annually. It goes to 17 years if you’re at 3%. This is also assuming only 20k in extra costs. No new kitchen and no new bathroom. This is closer to buying a new construction or very well updated home.
Considering that most folks are going to have some money in equities or other higher yield (albeit higher risk) investments, the breakeven is likely even worse outside of some of the craziness we’ve seen in the housing market the past few years.
Conclusions
The reality of buying a home as the financially savvy thing to do is the standard advice. I’m not saying it isn’t the right move, but it’s important to consider that it isn’t always the best overall choice for everyone and every situation.
So when does it make sense? Let’s look at our equation again:
-rt = I-mt-C
If rent is high, buying looks better. If the mortgage payment is low, buying looks better. If appreciation on the home is high, buying looks better. If you intend to stay in the same location for a long time, buying looks better.
On the other hand, if appreciation is expected to be depressed, mortgage rates are elevated, and costs associated with buying are high, rent and investing liquid assets somewhere safe will likely be the better way.